The Role of Hearing Health Professionals in Fittings
During a hearing aid fitting there are several steps. Your hearing health
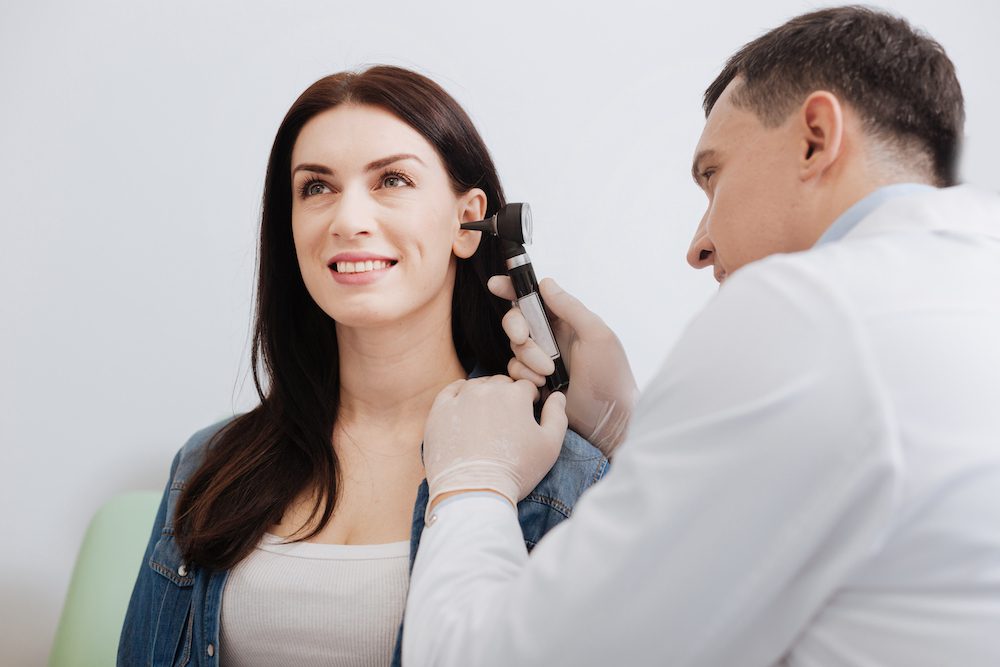

During a hearing aid fitting there are several steps. Your hearing health
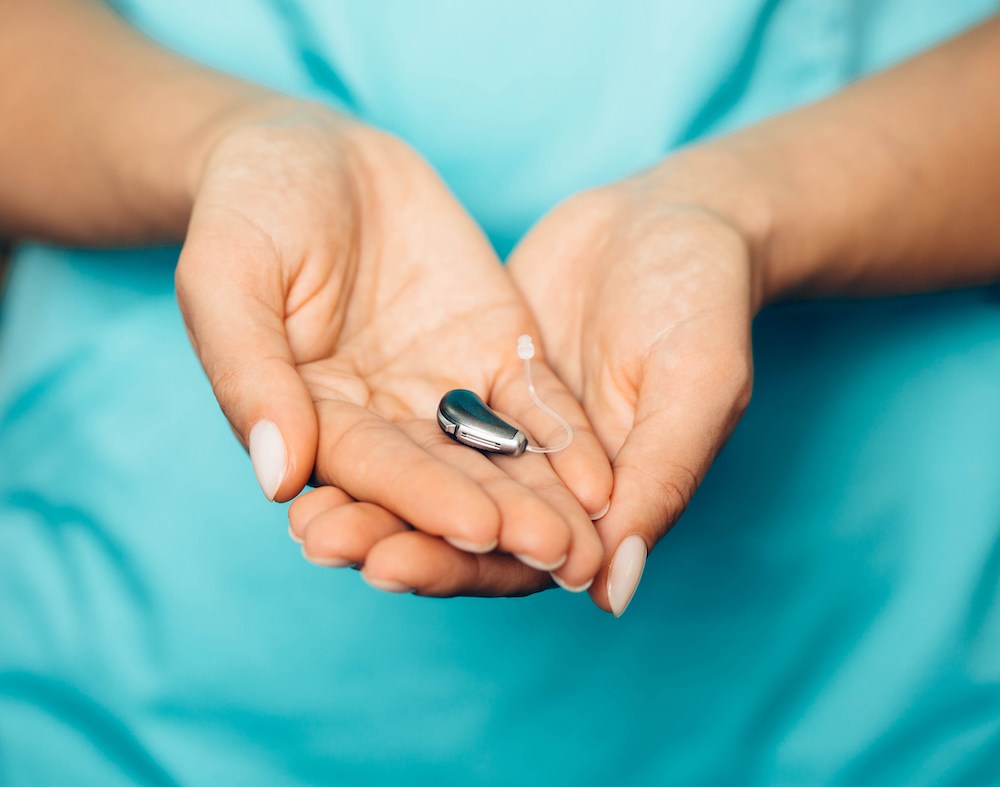
Taking care of your ears is so important when it comes to maintaining good

If you’re experiencing hearing loss, then it’s recommended to get in